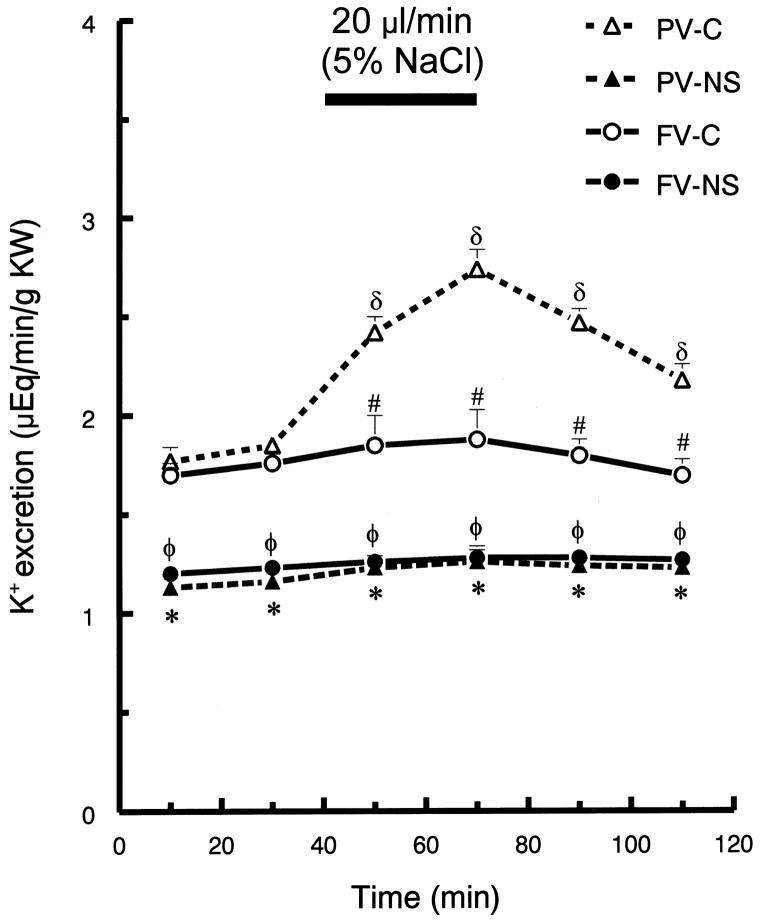
Fig. 3.
Urinary potassium excretion (UKV) before and after hypertonic saline infusion into either portal vein (PV) or femoral vein (FV) of control (C) and nephrotic (NS) rats. See Fig. 1 for brief protocol. Values are means ± SEM (n=8); δ p< 0.05 compared to mean baseline values within group; * p < 0.05 PV-C versus PV-NS; # p < 0.05 PV-C versus FV-C; φ p < 0.05 FV-C versus FV-NS; Tukey’s test.

