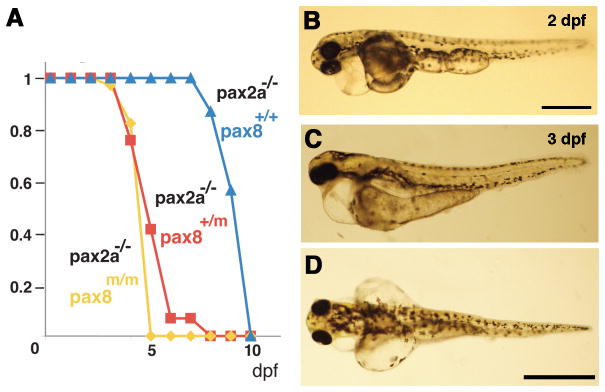
Figure 8.
Pax2a/pax8 double mutant. A: Survival curve of pax2a mutants with different pax8 genotypes. Blue, red and yellow represents pax8+/+, pax8+/m, pax8m/m fish, respectively. B: Lateral view of a double mutant embryo at 2 dpf. Scale: 500 μm. C, D: Lateral (C) and dorsal (D) view of a 3 dpf double mutant larvae. Scale: 1 mm.

