
Figure 1.
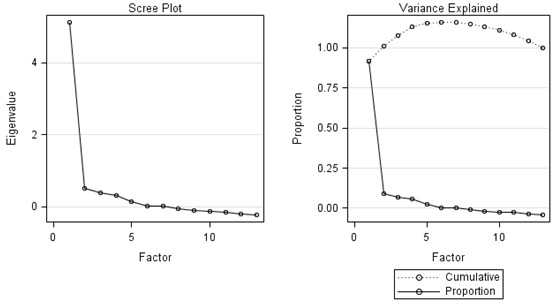
Eigenvalue diagram of the factor analysis of the questionnaire for treatment burden. The scree plot shows a break before factor 2, which suggests a unidimensional solution. 'Does not apply' was considered the lowest possible score (0).
Official websites use .gov
A
.gov website belongs to an official
government organization in the United States.
Secure .gov websites use HTTPS
A lock (
) or https:// means you've safely
connected to the .gov website. Share sensitive
information only on official, secure websites.
Eigenvalue diagram of the factor analysis of the questionnaire for treatment burden. The scree plot shows a break before factor 2, which suggests a unidimensional solution. 'Does not apply' was considered the lowest possible score (0).