Figure 15.

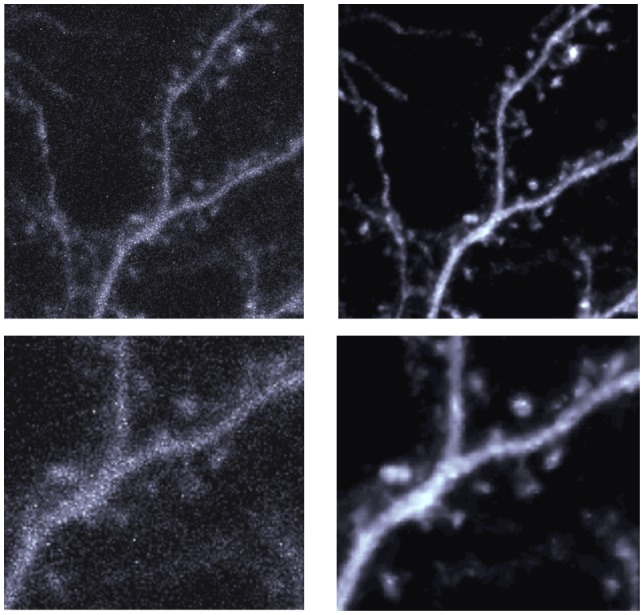
Maximum intensity projection of olfactory neuron of frog. Left: Original acquired image. Right: Denoised image with CANDLE. Top: the full images before and after denoising. Bottom: Zoom on the central part of the image.

Maximum intensity projection of olfactory neuron of frog. Left: Original acquired image. Right: Denoised image with CANDLE. Top: the full images before and after denoising. Bottom: Zoom on the central part of the image.