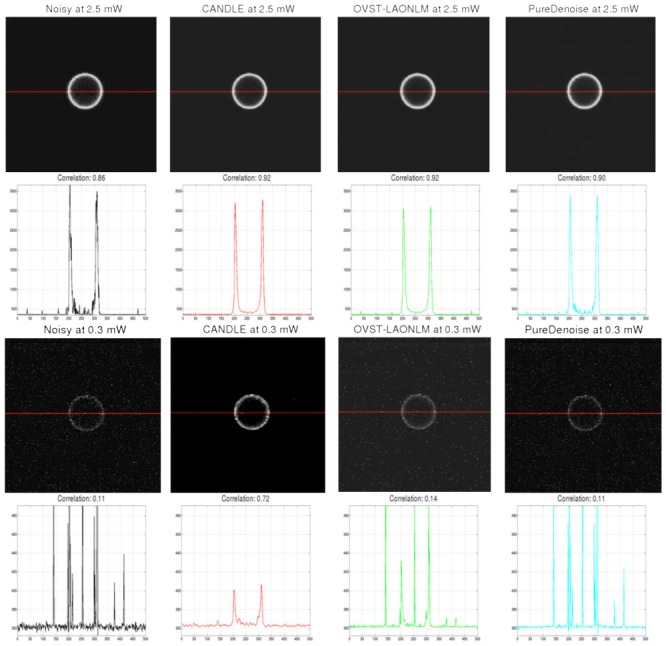
Figure 7.

Denoising results obtained by the CANDLE, OVST-LAONLM and PureDenoise filters on images of a microshpere (15 μm diameter).. Top: noisy image at high power (2.5mW) and the denoised images obtained by the methods compared. The values of the red lines are plot for each filter and the corresponding correlation coefficients are given. Bottom: Similar results obtained at very low power (0.3mW). For denoised images, contrast was adjusted manually to minimize the appearance of residual spike noise to avoid saturation in the figure. For intensity profiles, identical axis range is used for all the methods and the noisy image. Saturation of the highest noise peaks was performed to display the signal of interest at an adapted scale.
