Fig. 2.
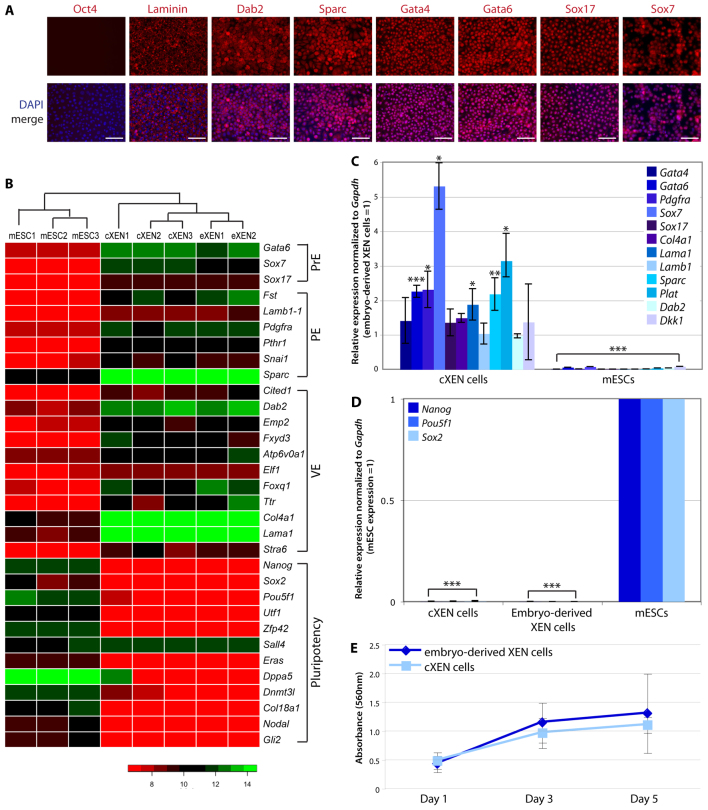
cXEN cells are identical to embryo-derived XEN cells. (A) Immunofluorescence analysis of stable cXEN cells (day 35) for Oct4, laminin, Dab2, Sparc, Gata4, Gata6, Sox17 and Sox7 expression (red) and DAPI (blue) merge (representative of three cXEN cell biological replicates). Scale bars: 100 μm. (B) Heat map of microarray data for pluripotency, primitive endoderm (PrE), visceral endoderm (VE), parietal endoderm (PE) or additional XEN cell-associated genes. Normalized gene expression values are represented by a colour heat map spectrum from high expression (green) to low expression (red). Data shown are biological replicates of cXEN cells, embryo-derived XEN cells (eXEN) and mESCs. (C,D) qRT-PCR analysis of cXEN cells (day 35) and mESCs for the expression of ExEn lineage-associated genes (C) (Gata4, Gata6, Pdgfra, Sox7, Sox17, Col4a1, Lama1, Lamb1, Sparc, Plat, Dab2 and Dkk1) or pluripotency associated genes (D) (Nanog, Pou5f1 and Sox2). Relative expression reflected as a fold difference compared with embryo-derived XEN cells or mESCs (=1), respectively. Data are mean±s.e.m. Three biological replicates. *P<0.05; **P<0.01; ***P<0.001. (E) MTT assay of the rate of proliferation of cXEN cells (day 35) compared with embryo-derived XEN cells. Cells were plated at the same cell density and analyzed after 1, 3 or 5 days of culture in standard XEN media. Data are the mean±s.e.m. Three biological and three technical replicates.

