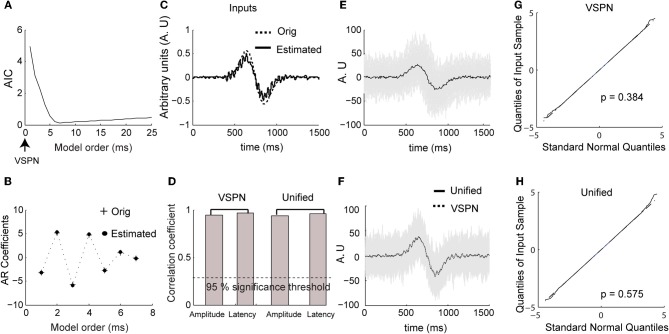
Figure 3.
Simulated LFP data. (A) Normalized Akaike information criterion (AIC) against unified model order. The optimum model order corresponds to the minima of the AIC curve. (B) The original AR coefficients (+) used to generate simulated data and the estimated coefficients (solid dots) of the unified model (corresponding to minimum of AIC curve in (A). (C) The original (dashed) and estimated (solid) input to unified model. (D) Correlation coefficient between original amplitude and estimated amplitude, original latency and estimated latency for VSPN and unified model. The dashed line below shows the value of correlation coefficient at p = 0.05 level. (E) Traces of simulated LFP data (gray) and averaged LFP (black) across all trials. (F) Traces of corrected LFP data following the unified model. (G) Quantiles of residual time series obtained from modeling with VSPN model plotted against standard normal quantiles. The p-value is from the Kolmogorov–Smirnov test on residual data against the null hypothesis that they come from a normal distribution. (H) Same as (G) but performed on residuals of unified model.

