
Figure 6.
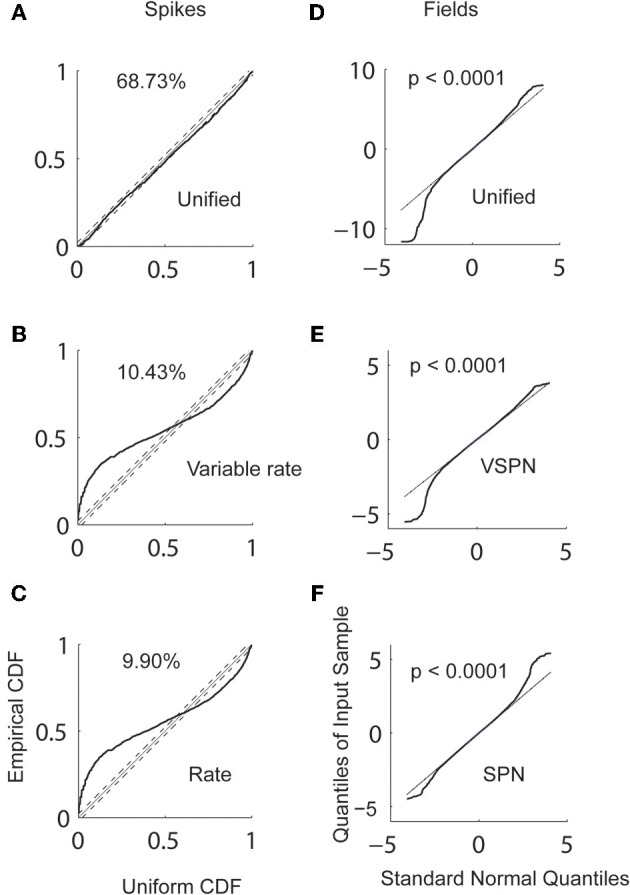
Goodness of fit analysis. The empirical cumulative density function (CDF) of rescaled inter-spike intervals using the conditional intensity of (A) unified (B) variable rate and (C) rate models are plotted against the CDF of a uniform distribution. The percentages of points in empirical CDF that falls within 95% confidence bound (dashed lines) of the theoretical CDF (dotted line) are reported. The quantiles of residuals LFPs from (D) unified (E) VSPN and (F) SPN models plotted against the quantiles of standard normal distribution. The p-values of K–S tests performed on the residual with the null hypothesis that the residual distribution is normal are reported.