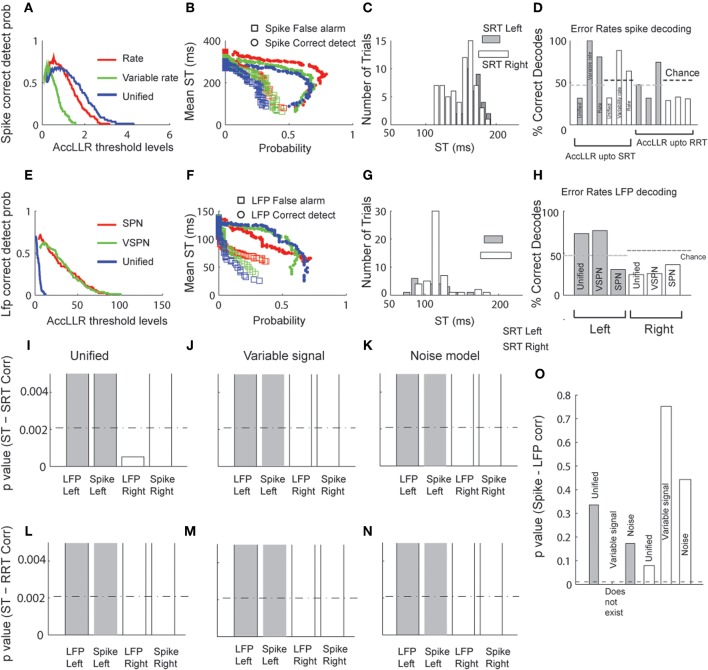
Figure 7.
Decoding of target selection times (ST) via AccLLR analysis. (A) Correct detect probabilities for leftward movements as a function of AccLLR levels computed using the unified model (blue), the VSPN model (green) and the SPN (red) model of LFP activity. The inverse of correct detect probability is the error rate. (B) Mean ST (from all correct decodes) obtained from each model for detecting movements to the left at varying false alarm (squares) and correct detect probabilities (circles) (see text for details). (C) Histograms of trial-by-trial ST for leftward and rightward movements. For direct comparison with behavior, mean SRT and RRT are shown for left (gray) and right (white) movement directions. (D) The error rates in decoding the correct direction (leftward or rightward) of movement from LFP activity. (E) Same as in (A), now computed for unified model (blue), variable rate model (green) and rate model (red) of spike trains. (F) Mean target selection time (ST) as a function of probabilities as in (B), computed using the three spike train models. (G) Trial-by-trial selection times decoded from spike trains for left and right movement directions. Conventions as in (C). (H) Error rates for spike trains. Since accumulation of log-likelihood ratios up to SRT could not perform better than chance for variable rate and the rate models, we allowed accumulation up to RRT. For comparison of the results from different models/movement directions we present (I–K) p-values of correlation between SRT and selection times from unified (I), variable rate (J) and rate (K) models respectively. Bonferroni correction thresholds at p = 0.05 (N = 24) are plotted in dashed lines. The bars are clipped at p = 0.005 to highlight smaller values (significant region of interest). (L–N) Same as in (I–K), except SRT replaced by RRT. (O) p-values of Spike-LFP selection time correlations. None of the correlations were significant. Bonferroni correction thresholds for p = 0.05 (N = 5) are plotted in dashed lines.

