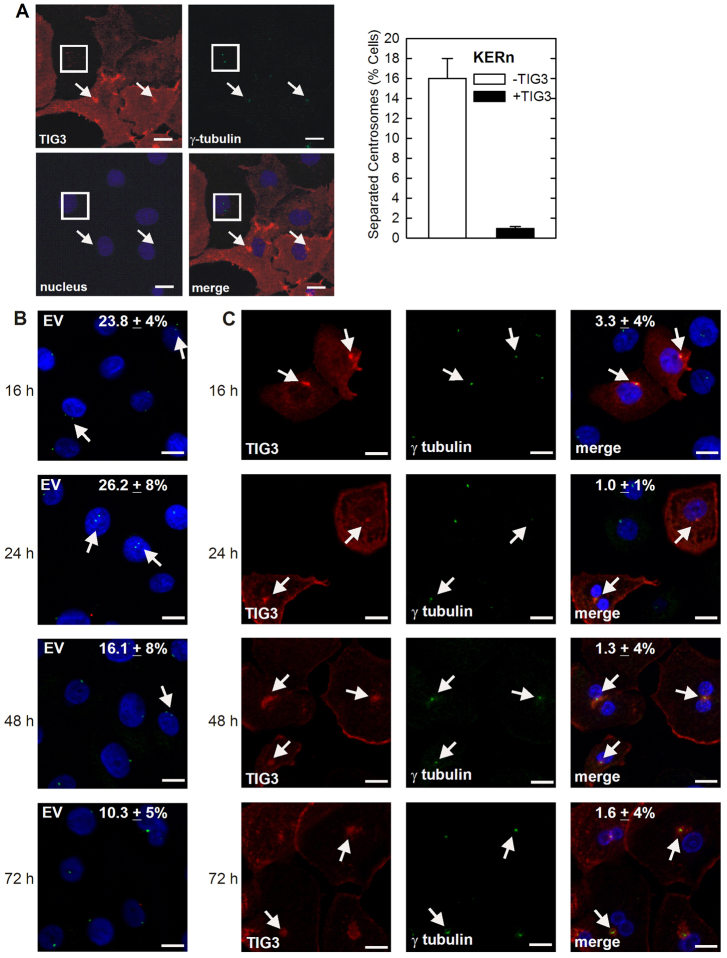
Fig. 6.
Impact of TIG3 on centrosome separation. (A) TIG3 inhibits centrosome separation. Normal human keratinocytes were infected with tAd5-TIG3 at a level that infects a subset of cells. At 24 hours post infection, cells were stained with anti-TIG3 (red) and anti-γ-tubulin (green) antibodies, and nuclei were visualized with Hoechst 33258. Arrows show the γ-tubulin at the centrosome (green). TIG3 is the red fluorescence. The rectangle indicates separated daughter centrosomes in a TIG3-negative cell. The plot indicates the percentage of control and TIG3-positive cells with separated centrosomes (± s.e.m., 50 cells were counted in each of the four experiments). Differences are significant as determined by Student's t-test, P<0.005. Scale bars: 10 μm. (B,C) Normal human keratinocytes were infected with tAd5-EV or tAd5-TIG3 at 0 hours and cultures were harvested at 16 hours, 24 hours, 48 hours and 72 hours post-infection, and were fixed and stained as in Fig. 6A. The arrows indicate centrosomes. The numbers indicate the percentage of cells displaying separated daughter centrosomes. The values are the mean ± s.d., n=50 cells counted. Similar results were observed in three separate experiments. Scale bars: 10 μm.

