
Figure 1.
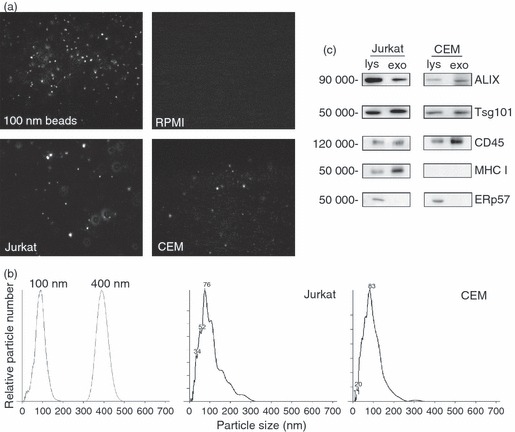
Nanoparticle tracking analysis (NTA) and immunoblotting analysis of microvesicles secreted by Jurkat and CEM cells. (a) Screenshots of NTA of 100-nm beads, serum-fee RPMI-1640, and post-10 000 g conditioned medium from Jurkat and CEM cells. Image size recorded by video is approximately 100 μm × 80 μm. (b) Size and particle distribution plots of 100-nm and 400-nm control beads, and post-10 000 g conditioned medium from Jurkat (peak at 76 nm) and CEM (peak at 83 nm) cells. (c) Immunoblot analysis of detergent cell lysates (lys) and exosome and microvesicles (exo, post-100 000 g pellets) of Jurkat and CEM cells.