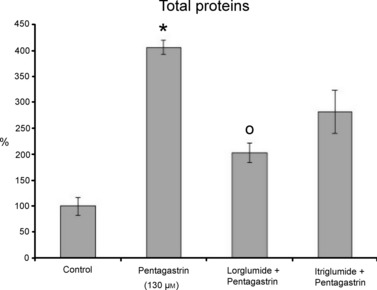
Fig. 7.

Percentage of total protein per mg of tissue, as detected in the media after treatment with pentagastrin (130 μm), and after inhibition with lorglumide and itriglumide. All data are expressed as % with respect to control. *Statistically significant with respect to control. ○ Statistically significant with respect to pentagastrin.
