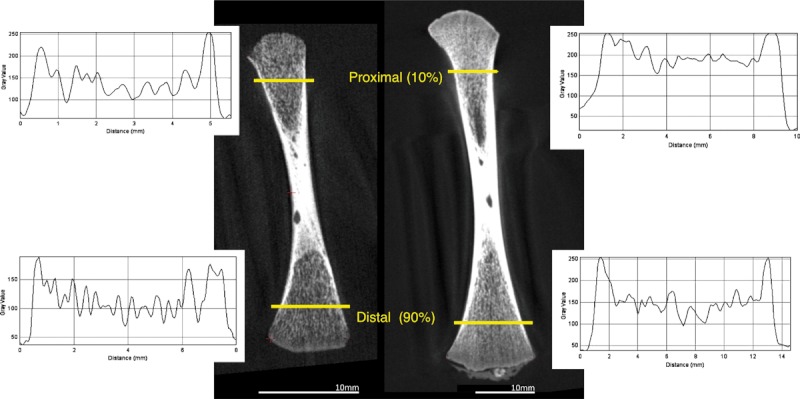
Fig. 1.

Threshold and quantification of trabecular structure using the HMH method. Profile plots were used to measure peaks (trabeculae) and troughs (non-bone) in grey values along two transects. Frequency and width of peaks corresponded to the number and thickness of trabeculae, respectively. The total width of the elements was used to calculate a measure of bone volume fraction.
