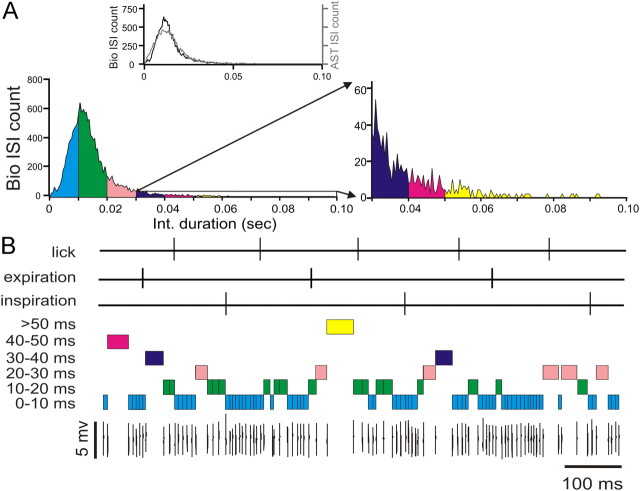
Figure 2.
Decomposition of the simple-spike portion of the spike train into interval groups of increasing duration. A, ISI histograms of a single-unit Purkinje cell simple spike train. The ISI distribution for a matched gamma-distributed spike train is shown in the inset. B, Illustration of the decomposition of a simple spike train into groups of interspike intervals of different durations. (Colors correspond to those in the interval histogram in A). Cross-correlation analyses between spike intervals and behavior were performed using the first spikes (i.e., the interval onsets) as the time of interval occurrence.

