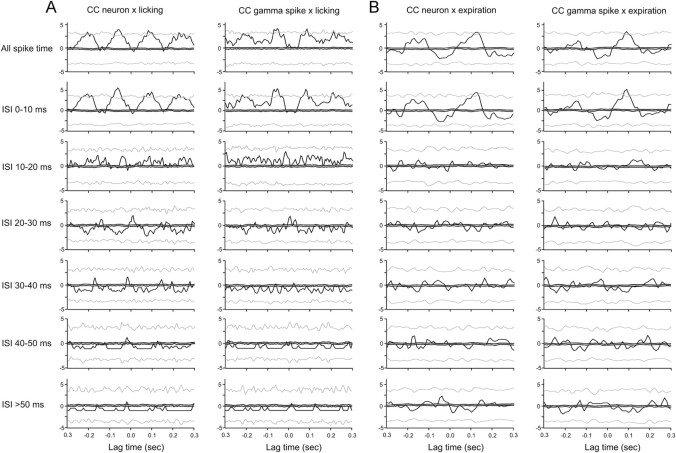
Figure 3.
Cross-correlation analyses of biological and surrogate Purkinje cell simple spike trains with licking and respiratory behavior. A, Left, Lick–simple spike cross-correlations for all simple spikes (top histograms) and for interspike intervals of increasing duration as denoted on the left of each row. In each histogram, the thin black lines represent the raw cross-correlation histogram. The two gray lines and the center black line represent the ±3 SDs and mean of the shuffled correlations. Right, Same analysis as on the left, but applied to surrogate spike trains and licking intervals. B, Same analysis as in A but for expiration–simple spike cross-correlations in the left column and the matching surrogate spike data on the right. The y-axis scales show z-scores.

