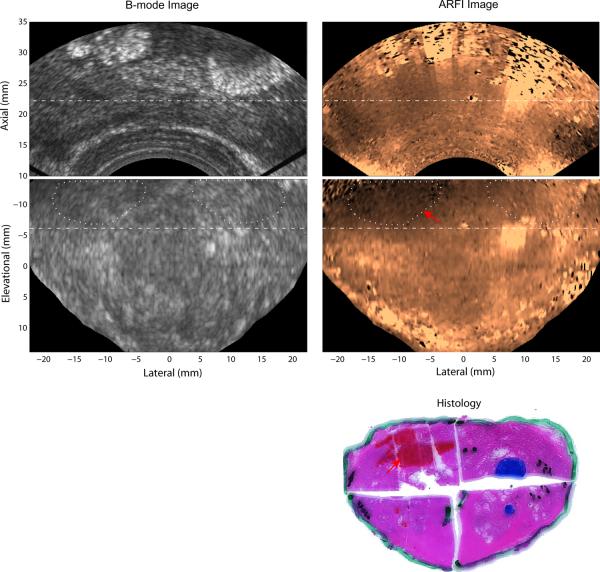
Figure 4.
Matched B-mode, ARFI and histological prostate images from Patient B. The top two rows are axial and coronal images, respectively. The two imaging planes intersect at the dashed lines with an angle of 74°. In the coronal ARFI image, the asymmetric stiff region indicated by the red arrow corresponds to the PCa (area masked in red) identified in the reconstructed whole-mount histological image (third row). The Gleason's score of this PCa is 3+3. The regions circled with white dotted lines were used to compute CNRs of the PCa in the B-mode and ARFI images.

