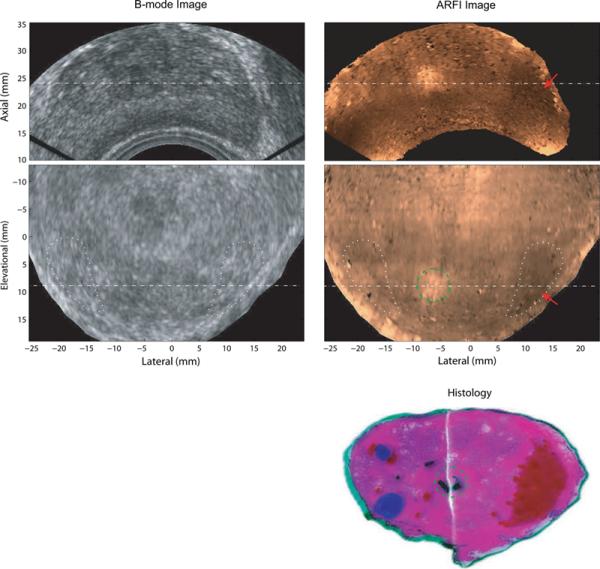
Figure 5.

Matched B-mode, ARFI and histological prostate images of Patient C. The top row shows axial B-mode and ARFI images. The middle row shows the coronal images. The two imaging planes intersect at the dashed lines with an angle of 20°. PCa is indicated by red arrows in ARFI images and marked red in the reconstructed whole-mount histological image. The two ejaculatory ducts are circled with green dashed lines. BPH nodules are masked in blue. The Gleason's score of this PCa is 3+4. The regions in the coronal view circled with white dotted lines were used to compute CNRs of the PCa in the B-mode and ARFI images.
