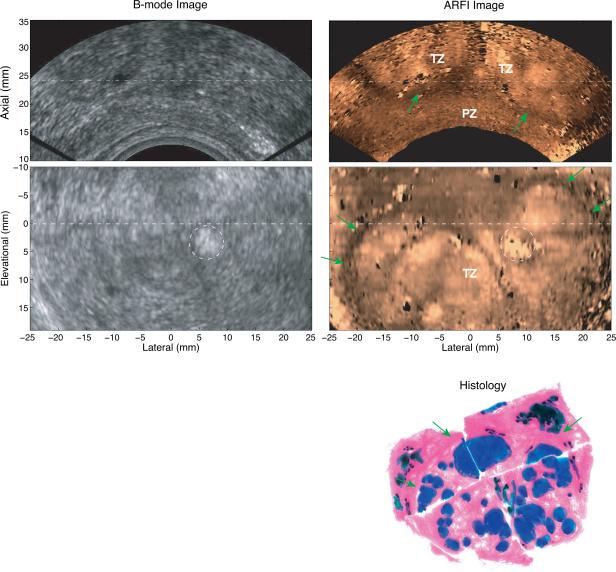
Figure 6.
Matched B-mode, ARFI images and a histological prostate image from Patient D. The top row shows axial B-mode and ARFI images. The middle row shows the coronal images. The two imaging planes are orthogonal to each other and intersect at the dashed lines. The green arrows indicate the boundary of the TZ. The hyperechoic region circled in the B-mode image is calcification. Complicated BPH nodules were identified (colored in blue) in the histological image.

