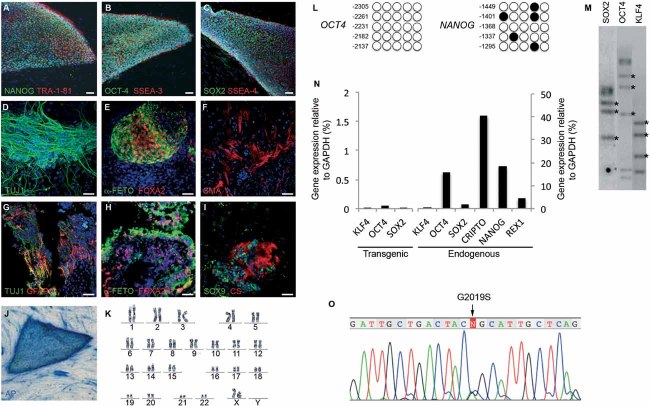
Figure 1. Generation and characterization of PD patient-specific iPSC lines.
A-C. Representative colonies of passage-20 LRRK2-PD-iPSC (cell line SP13.4) stained positive for the pluripotency-associated markers NANOG, OCT4 and SOX2 (green), TRA-1-81, SSEA3 and SSEA4 (red).
D-F. Immunofluorescence analyses of LRRK2-PD-iPSC (cell line SP13.4) differentiated in vitro show the potential to generate cell derivatives of all three primary germ cell layers including ectoderm (D, stained for TUJ1, green), endoderm (E, stained for α-fetoprotein, green, and FOXA2, red) and mesoderm (F, stained for smooth muscle actin, SMA, red).
G-I. Immunofluorescence analyses of sections from a teratoma induced by injecting LRRK2-PD-iPSC (cell line SP13.4), showing derivatives of the three main embryo germ layers: ectoderm (G, stained for TUJ1, green, and GFAP, red), endoderm (H, stained for α-fetoprotein, green, and FOXA2, red) and mesoderm (I, stained for SOX9, green, and chondroitin sulphate, CS, red). In (A–I) nuclei are counterstained with DAPI, shown in blue. Scale bars, 50 µm.
J. LRRK2-PD-iPSC (cell line SP13.4) stained for alkaline phosphatase (AP) activity.
K. Normal karyotype of LRRK2-PD-iPSC (cell line SP13.4) at passage 20.
L. Bisulphite genomic sequencing of the OCT4 and NANOG promoters showing demethylation in LRRK2-PD-iPSC (cell line SP13.4).
M. Southern blot analysis of LRRK2-PD-iPSC (cell line SP13.4) showing genomic integrations (asterisk) of the indicated retroviruses.
N. RT-qPCR analyses of the expression levels of retroviral-derived reprogramming factors (transgenic) and endogenous expression levels (endogenous) of the indicated genes in LRRK2-PD-iPSC (cell line SP13.4).
O. Direct sequence of genomic DNA from LRRK2-PD-iPSC (cell line SP13.4) identifying the LRRK2G2019S mutation.

