
Figure 3. Abnormal SNCA accumulation in DA neurons from LRRK2-PD iPSC.
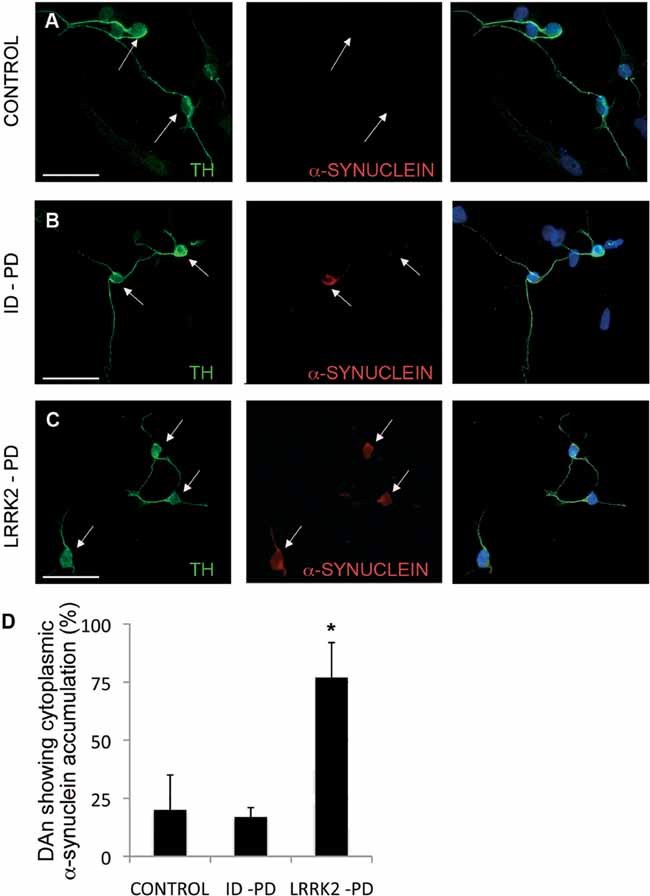
A-C. Immunofluorescence analyses of DA neurons after 30 days of differentiation from Crtl-iPSC (A), ID-PD iPSC (B) and LRRK2-PD iPSC (C), co-stained for TH (green) and SNCA (red). Arrows point to DA neurons, as identified by TH positive staining.
D. Quantitative analyses of DA neurons showing cytoplasmic accumulation of SNCA. Bars represent average with SEM as error bars. Data is the average of at least two-independent experiments using 3 Ctrl-iPSC lines, 4 ID-PD iPSC lines and 3 LRRK2-PD iPSC lines. The differences in the number of DA neurons showing accumulation of SNCA are statistically significant (asterisk) when comparing those derived from LRRK2-PD iPSC with either those from Ctrl-iPSC (p = 0.019) or from ID-PD iPSC (p = 0.002) [F(2,16) = 6.888; p = 0.007].