
Figure 4. Morphological alterations of PD-iPSC-derived DA neurons after long-term culture.
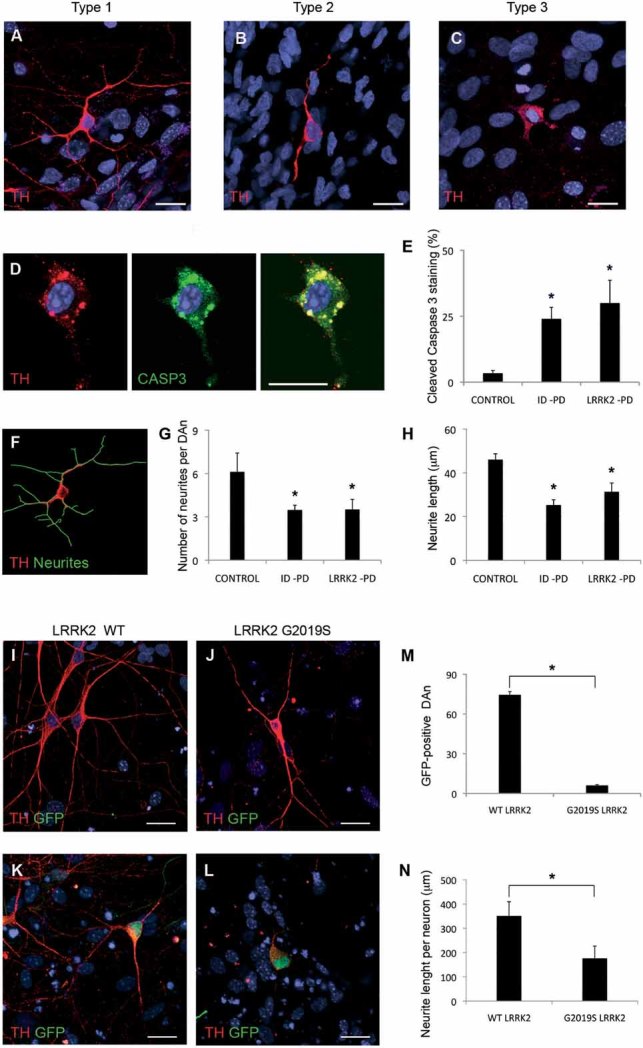
A-C. Immunofluorescence analyses of Ctrl-iPSC (cell line SP11.1, A), ID-PD iPSC (cell line SP08.1, B) and LRRK2-PD iPSC (cell line SP06.2, C), differentiated towards DA neurons and cultured for 75 days on cortical astrocytes, stained for TH (red). Images are representative of the three morphologies of DA neurons found under these conditions.
D. Immunofluorescence analysis of DA neurons differentiated from LRRK2-PD iPSC (cell line SP06.2) for 75 days, co-stained for TH (red) and cleaved caspase-3 (green). In A–D nuclei are counterstained with DAPI, shown in blue. Scale bar, 12.5 µm.
E. Quantitative analyses of the percentage of DA neurons differentiated for 75 days showing cleaved caspase-3 staining. Data for CONTROL is the average of 4 iPSC lines, for ID-PD from 7 iPSC lines and LRRK2-PD from 4 iPSC. Asterisks denote statistically significant differences between CONTROL and ID-PD (p = 0.004) or LRRK2-PD (p = 0.011) [F(2,12) = 5.668; p = 0.018].
F. Image of the same DA neuron shown in (A), with neurites outlined by green traces as processed by NIH ImageJ software.
G. Quantitative analyses of the number of neurites in DAn differentiated for 75 days. Data for CONTROL is the average of 87 DAn from 4 iPSC lines, for ID-PD is from 119 DAn from 7 iPSC lines and for LRRK2-PD is from 91 DAn from 4 iPSC. Asterisks denote statistically significant differences between CONTROL and ID-PD (p < 0.001) or LRRK2-PD (p < 0.001) [F(2,294) = 21.096; p < 0.001].
H. Quantitative analyses of the neurite length in DA neurons differentiated for 75 days. Data for CONTROL is the average of 540 neurites from 4 iPSC lines, for ID-PD is from 409 neurites from 7 iPSC lines and for LRRK2-PD is from 303 neurites from 4 iPSC. Asterisks denote statistically significant differences between CONTROL and ID-PD (p < 0.001) or LRRK2-PD (p < 0.001) [F(2,1249) = 42.161; p < 0.001]. (E, G and H) bars represent average with SEM as error bars.
I-L. DAn (TH positive, red) and GFP (green) from Ctrl-iPSC (SP11.1) co-transfected with plasmids encoding WT LRRK2 (WT, I and K) or mutant LRRK2G2019S (J and L) and GFP. (I and J) Images showing GFP negative DA neurons. (K and L) Co-transfected DA neurons being GFP positive. Nuclei are counterstained with DAPI, shown in blue. Scale bar, 12.5 µm.
M. Quantitative analysis of the number of GFP positive neurons present in co-transfected cells.
N. Quantitative analyses of the neurite length per neuron in co-transfected DAn. For (M and N) data are average of two-independent experiments using two different Ctrl-iPSC lines. Bars represent average with SEM as error bars. Statistically significant differences are indicated with asterisks (p = 0.003 in M; p = 0.006 in N).