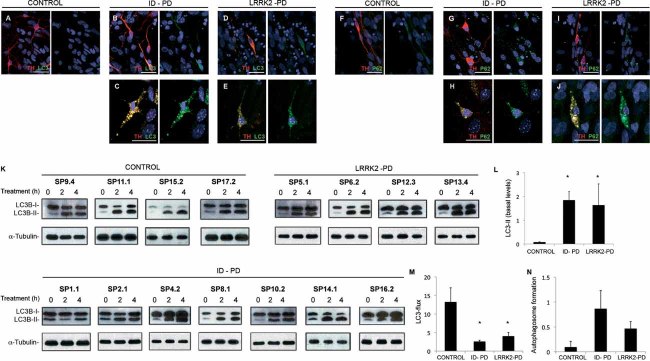
Figure 5. Alterations in autophagic clearance in DA neurons from PD patient-specific iPSC.
A-E. Immunofluorescence analyses of Ctrl-iPSC (cell line SP17.2, A), ID-PD iPSC (cell line SP16.2, B and C) and LRRK2-PD iPSC (cell line SP12.3, D and E), differentiated towards DA neurons and cultured for 75 days on cortical astrocytes, co-stained for LC3 (green) and TH (red). Images are representative of the most abundant morphologies of DA neurons found under these conditions.
F-J. Immunofluorescence analyses of Ctrl-iPSC (cell line SP17.2, F), ID-PD iPSC (cell line SP10.2, G and H) and LRRK2-PD iPSC (cell line SP06.2, I and J), differentiated towards DA neurons and cultured for 75 days on cortical astrocytes, co-stained for p62 (green) and TH (red). Images are representative of the morphologies of DA neurons found under these conditions. In A–J, nuclei are counterstained with DAPI, shown in blue. Scale bars, 35 µm.
K. Western blot analysis for LC3 in DA neuron cultures at 75 days of differentiation from the indicated iPSC lines, treated with leupeptin and NH4Cl during the indicated period of time. α-tubulin is used as a loading control.
L. Quantification analyses of the basal levels (treatment time = 0) of LC3-II relative to α-tubulin. Asterisks denote statistically significant differences between CONTROL and ID-PD (p = 0.003) and between CONTROL and LRRK2-PD (p = 0.046) [F(2,12) = 4.253; p = 0.046].
M. Quantification of LC3 flux normalized to α-tubulin. Asterisks denote statistically significant differences between CONTROL and ID-PD (p = 0.002) and between CONTROL and LRRK2-PD (p = 0.029) [F(2,12) = 9.614; p = 0.003].
N. Quantification of the autophagosome formation normalized to α-tubulin. No significant differences were found among groups [F(2,12) = 1.570; p = 0.248]. (L–N) Data per each group is the average of the blots shown in K. Bars represent average with SEM as error bars.

