
Figure 6. Autophagic system in iPSC-derived neurons.
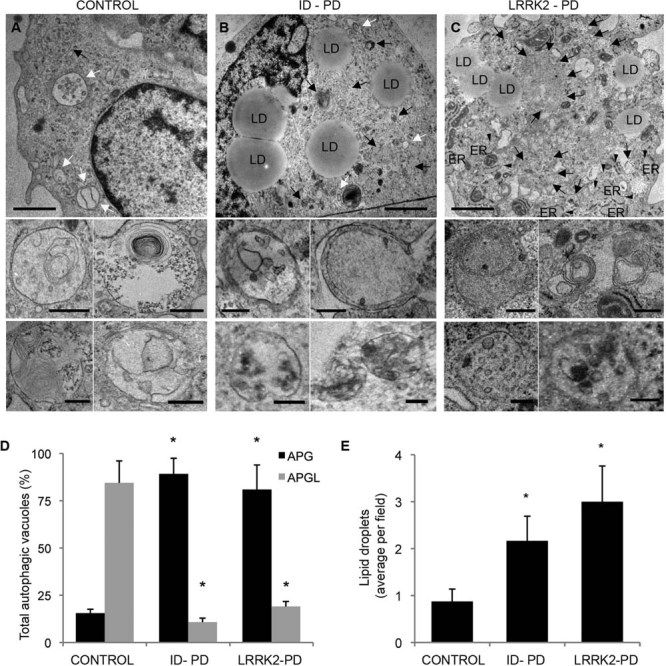
A-C. Ultrastructure of DA neurons at 75 days of differentiation from Ctrl-iPSC (A), ID-PD iPSC (B) and LRRK2-PD (C) iPSC. Lower inserts show higher magnification images to illustrate individual examples of autophagic vacuoles. Black arrows: autophagosomes; white arrows: autophagolysosomes; arrowheads: dilated ER; LD: lipid droplets. Scale bars: 0.5 µm (top) and 0.2 µm (bottom).
D. Percentage of autophagosomes (APG) and autophagolysosomes (APGL) relative to the total amount of autophagic vacuoles per field. Asterisks denote statistically significant differences in the percentage of autophagosomes [F(2,16) = 28.274; p < 0.001] and of autophagolysosomes [F(2,16) = 8.894; p = 0.003] between CONTROL and ID-PD (autophagosomes, p < 0.001; autophagolysosomes, p = 0.003), and between CONTROL and LRRK2-PD (autophagosomes, p = 0.003; autophagolysosomes, p = 0.010).
E. Content of lipid droplets per field. Asterisks denote statistically significant differences [F(2,16) = 28.274; p < 0.001] between CONTROL and ID-PD (p = 0.010), and between CONTROL and LRRK2-PD (p = 0.013). Bars represent average with SEM as error bars (n = 4–8).