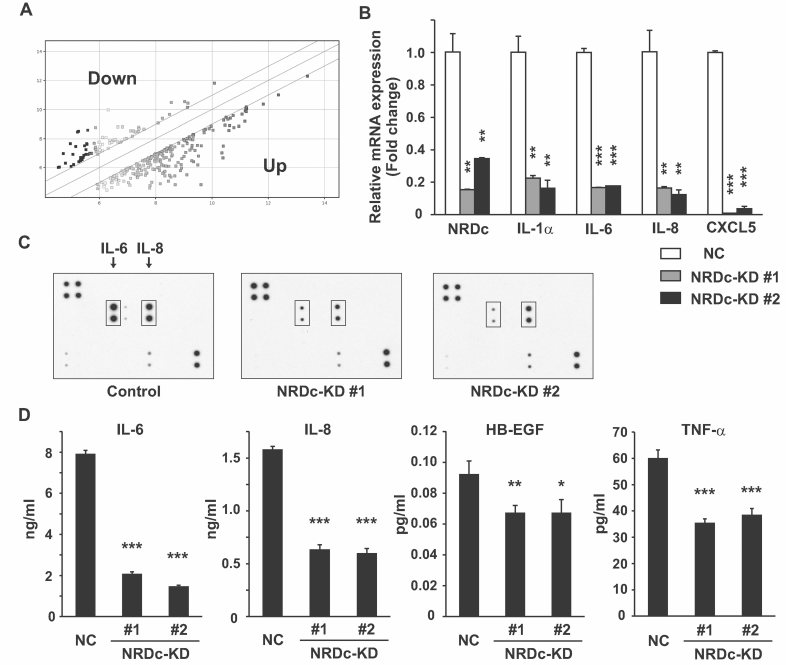
Figure 3. Changes in gene and protein expression profiles after knockdown of NRDc expression in gastric cancer cells.
- Gene expression analysis by microarray. Total RNA was extracted from the NC or NRDc-KD #1 TMK-1 cells and subjected to microarray analysis using the Affymetrix GeneChip Human Gene 1.0 ST Array. The scatter plot shows the genes upregulated (bottom right) or downregulated (top left) more than twofold in the NRDc-KD cells against the control cells.
- Total RNA was extracted from the NC or NRDc-KD TMK-1 clones, and qRT-PCR was performed for the indicated genes.
- Protein expression profile in CM from the control or stable NRDc-KD TMK-1 clones was screened using the antibody array. Positions of IL-6 and IL-8 are indicated.
- Concentrations of the indicated proteins in CM from each stable clone were quantified by ELISA. Results are shown as mean ± SD of triplicate samples.

