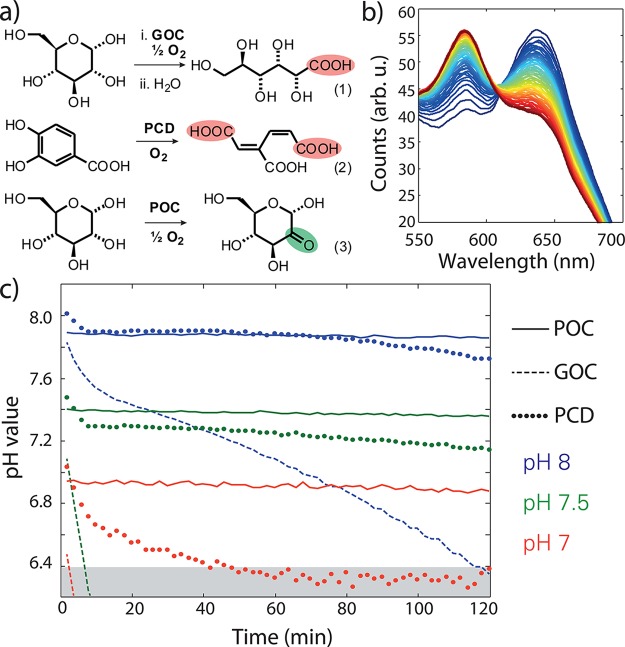
Figure 1.
(a) GOC, PCD, and POC reactions. (b) Time series of fluorescence spectra of SNARF-1 in solution with GOC and 10 mM Tris:HCl-buffer. An emission spectrum was recorded every 2 min (blue to red). (c) pH value evolution for GOC (dashed), PCD (dotted), and POC (solid) with different starting pH. The grayed area indicates saturation of the SNARF-1 sensor.

