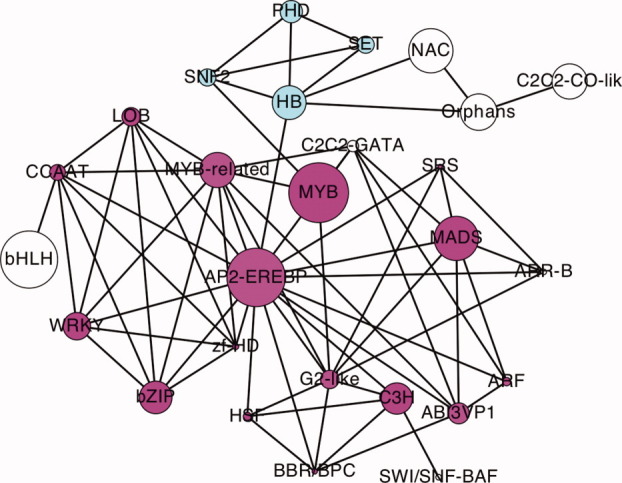
Figure 3.

The DBD network of TF families. The size of each node scaled according to the size of families. Two family clusters are highlighted with two different colors. [Color figure can be viewed in the online issue, which is available at wileyonlinelibrary.com.]
