Figure 2.

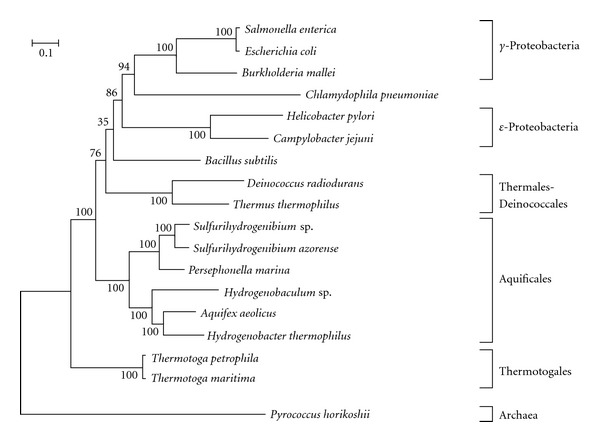
Maximum likelihood tree based on the comparison of 62 proteins; 10,000 amino acid sites were considered (see Section 2). The number at each node represents the percentage in the bootstrap analysis (200 replicates).

Maximum likelihood tree based on the comparison of 62 proteins; 10,000 amino acid sites were considered (see Section 2). The number at each node represents the percentage in the bootstrap analysis (200 replicates).