
Figure 4.
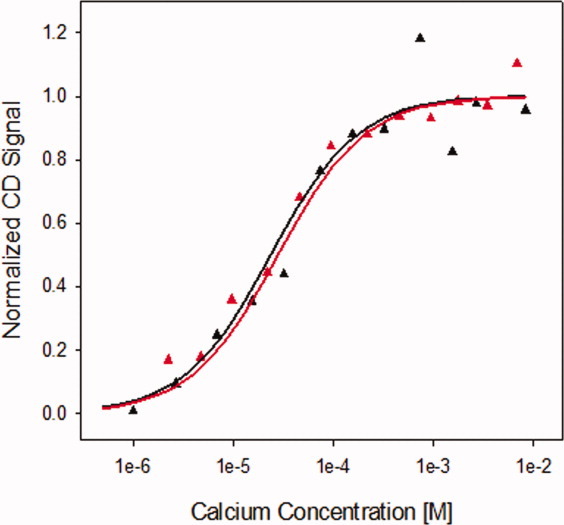
Calcium titrations of wild-type and X-enabled NCAD12. The CD signal changes during the calcium titrations of wild-type (black) and X-enabled NCAD12 (red) monitored by circular dichroism at 229 nm. Protein concentration was 2.5 μM. The lines are simulated based on parameters resolved from fits to Eq. (1).