
Figure 5.
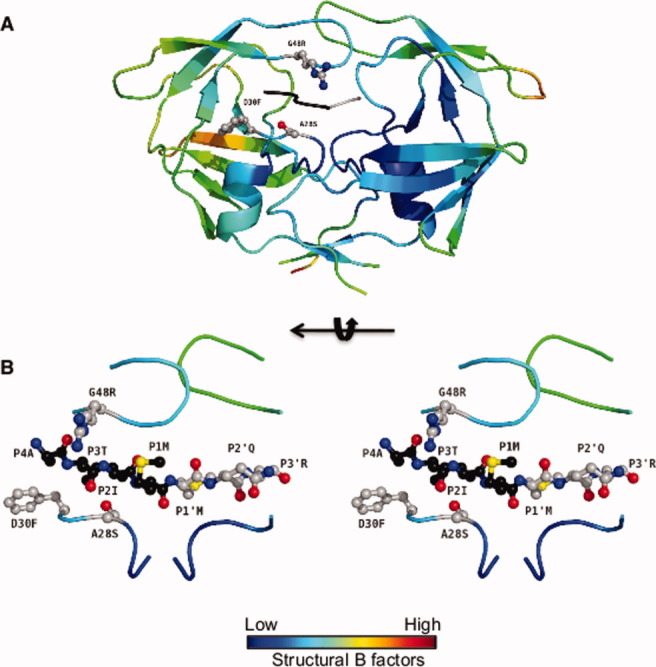
Pr3 in complex with p2-NC. (A) The protease molecule is colored according to the B factor values and represents an average structure of both possible protein orientations. One of the flaps is less ordered as reflected in light green color representing higher B factor values. (B) Stereo representation: The substrate p2-NC is uniquely oriented in the structure. The N and C terminal residues p2-NC, with respect to the scissile bond are colored black and gray, respectively.