
Figure 2.
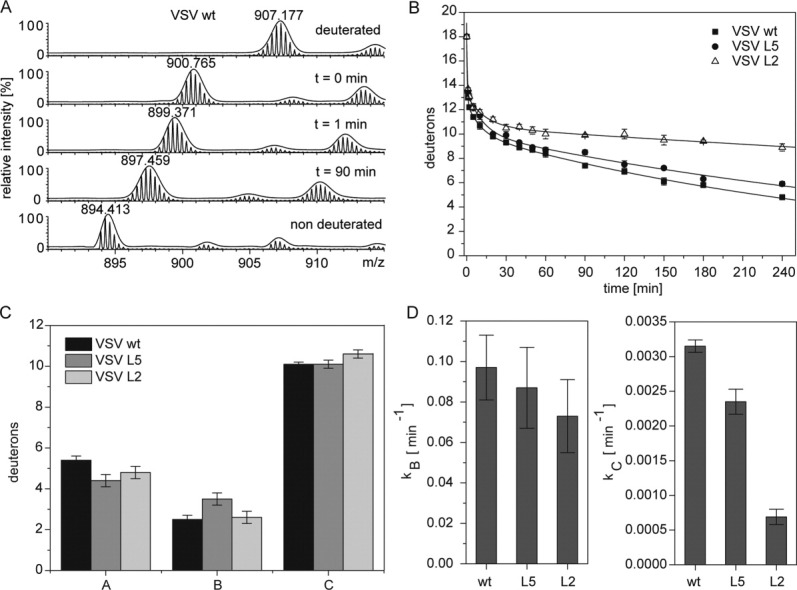
DHX kinetics. A: Exemplary mass spectra of the triply-charged VSV wt ion after different DHX reaction periods. The spectrum at t = 0 min was recorded after exchange under quench conditions (≤2 min on ice at pH 2.5). Low intensity isotopic envelopes at calculated masses of ∼22 Da and ∼38 Da above the dominant envelopes likely originate from Na+- and K+-adducts, respectively. The fully protonated TMD is shown for comparison. B: Exchange kinetics. The data points at t = 0 correspond to the numbers of amide deuterons seen after exchange under quench conditions. The data were fit with a three-term exponential function assuming the presence of 18 deuterium atoms at t = 0 min (continuous lines). Data points (>0 min) are means ± SD, n = 3. C: The sizes of the deuteron populations as taken from the fit. D: Mean exchange rate constants as taken from the fits. Error bars in C and D signify the deviation of the fit functions from the experimental data points.