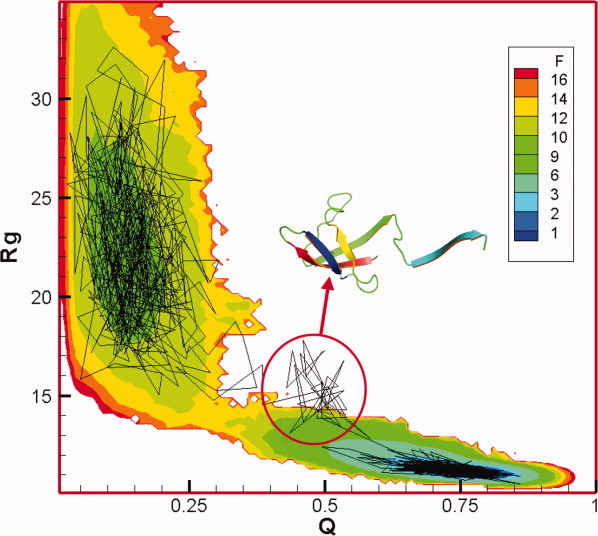
Figure 4.

The 2D free-energy profile for Rg and Q at T = 0.402. Different colors represent the corresponding free energy reduced by kBT. One typical folding trajectory from kinetic simulations is also shown in this plot. The intermediate is highlighted by a circle and one typical snapshot is shown. [Color figure can be viewed in the online issue, which is available at wileyonlinelibrary.com.]
