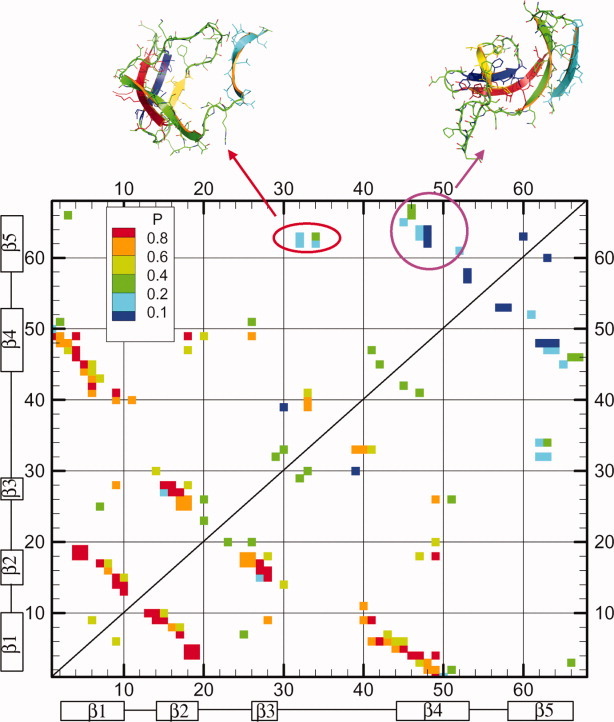
Figure 5.

The average residue–residue contact map is shown for 20 transition state structures. Different colors represent the corresponding probability of native contacts. Two representative TS structures are shown in the top. [Color figure can be viewed in the online issue, which is available at wileyonlinelibrary.com.]
