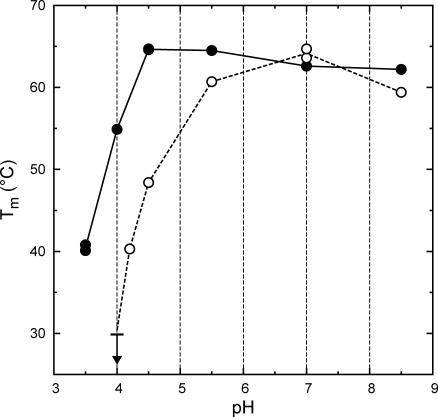
Figure 2.

Thermal denaturation of H6UctB (filled circles) and H6YfdW (open circles) monitored by CD as a function of pH. Tm values were determined using changes in molar ellipticity at 222 nm, corresponding to loss of helical structure. The lines connect average Tm values at each pH for H6UctB (solid line) and H6YfdW (dotted lines); H6UctB duplicates at pH 4.5 and 7.0 have completely overlapping symbols. The arrow at pH 4.0 for H6YfdW indicates a maximum for a partially observed melting transition. At pH 3.5, H6YfdW melted completely during equilibration at 20°C. Full CD spectra (recorded at 20°C) and thermal unfolding profiles are given as Figures S4–7 of the Supporting Information.
