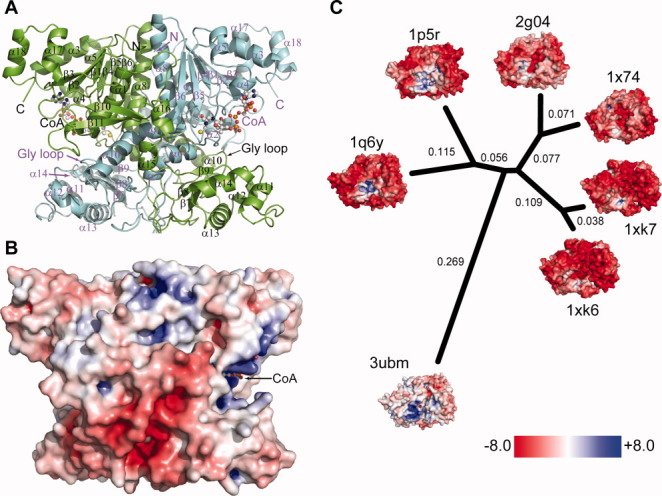
Figure 3.

Structure of H6UctB bound to CoA (PDB id 3ubm). A: Elements from both subunits make up the H6UctB active sites, each occupied by CoA (ball-and-stick rendering). Secondary structure elements are labelled; a topology diagram is provided as Figure S8 in the Supporting Information. B: Electrostatic surface potential of H6UctB (subunits A/B) viewed in the same orientation as panel A. Positive and negative regions were scaled as in panel C. Additional orientations are shown in Supporting Information Figure S13. C: Comparison of charge decoration in a set of protein structures with very similar backbone topologies. The indicated phylogenetic tree was generated using Euclidean distances between the 3DZDs. The numbers in black are the computed distance of corresponding branches and the branch lengths are proportional to the distances between the proteins. The PDB identifiers and DALI Z scores are 1q6y, E. coli YfdW, CoA complex (Z = 49.2)30; 1p5r, O. formigenes FRC, CoA complex (Z = 46.6)28; 1xk6 and 1xk7, E. coli CaiB in two crystal forms (Z = 34.2 and 33.8, respectively); 1x74, Mycobacterium tuberculosis α-methyl-CoA racemase (Z = 29.5); and 2g04, M. tuberculosis fatty acid-CoA racemase (Z = 28.7). The thumbnail figures are rotated to show the positively-charged (acyl-)CoA binding pocket.
