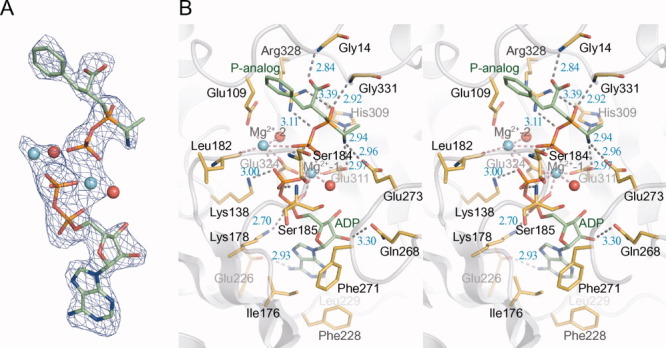
Figure 3.

Structure of BacD in complex with ADP, the P-analog, and two magnesium ions. A: The |Fo| − |Fc| electron density map around ADP and the P-analog contoured at 3.0 σ is represented with a blue mesh. Nonprotein atoms were omitted in the calculation of Fc. ADP and the P-analog are drawn with stick models, and magnesium ions and water molecules are shown with cyan and red balls, respectively. B: The stereo view of the substrate-binding site of BacD is drawn with residues involved in the interaction highlighted and labeled. Hydrogen bonds/electrostatic interactions and coordination bonds to magnesium ions are depicted with dashed lines of gray and red, respectively.
