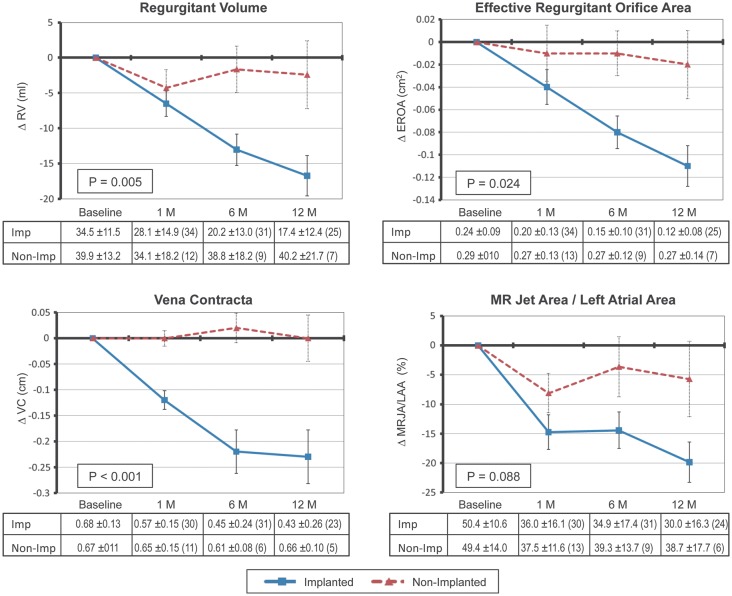
Figure 2.
Echocardiographic changes in functional mitral regurgitation severity between implanted (n =36) and non-implanted (n =17) patients as assessed by regurgitant volume (RV), effective regurgitant orifice area (EROA), vena contracta (VC), and mitral regurgitation jet area/left atrial area (MRJA/LAA). P-values were computed by comparing the difference between the two groups from baseline to 12 months. The number of patients at each time point is noted in parentheses in the tables corresponding to each plot.

