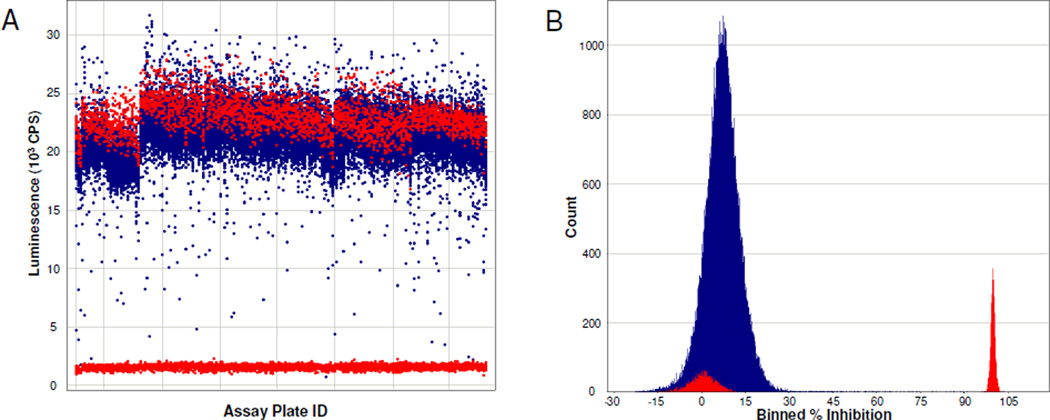
Figure 1.
HTS data for the luminescence-based TNAP assay. MLSMR compound collection was screened at 20 uM compound concentration in the assay. The actual experimental data from screening 191 assay plates on seven different days is displayed in panel A without further modifications. Compounds inhibition calculated according to Eq. 1 is summarized in panel B in a histogram format. Tested compounds and control wells are depicted in blue and red color, respectively. Graphs are prepared using Spotfire software (TIBCO).

