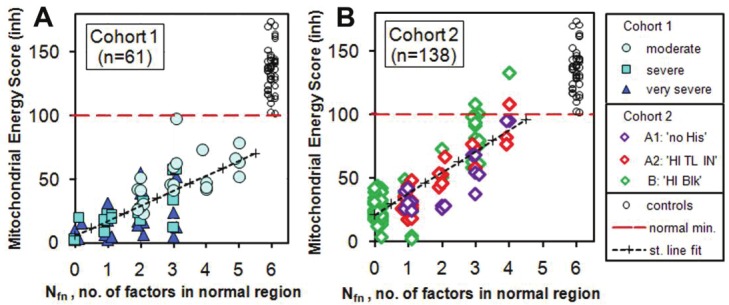
Figure 1.

Plots of revised Mitochondrial Energy Score MESinh vs Nfn for controls and the two patient cohorts. For Cohort 1 the patients are divided into the categories ‘moderate’, ‘severe’ and ‘very severe’. For Cohort 2 the patients are divided into Group A (NO BLOCK, with sub-groups A1: 'no HIs' and A2: 'HI TL IN') and Group B (BLOCKED, with label B: 'HI Blk'). Details of the method of computing the revised Mitochondrial Energy Score, and definitions of the Groups are explained in detail in the next section. The linear regression fits to the patient data give correlation coefficients r = 0.72 and r = 0.83 for Cohorts 1 and 2 respectively. The control points extend up as high as 257 with a mean value of 144.
