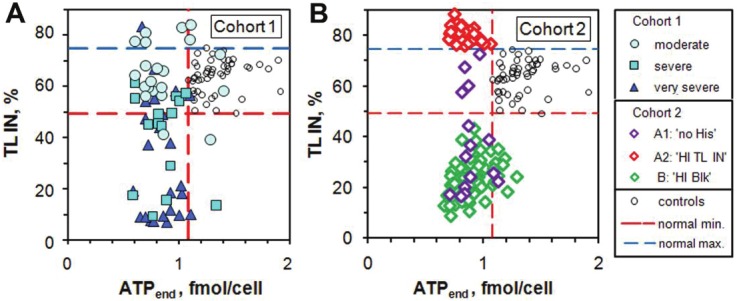
Figure 2.

Plots of TL IN vs ATPend for controls and patients in Cohorts 1 and 2. There are few Cohort 1 patients with supernormal values of TL IN but many more in Cohort 2. Cohort 1 has a higher fraction of patients in the normal region of TL IN than has Cohort 2. Note the sharp lower cut-offs of ATPend for the controls and for the 2 patient cohorts, which are much lower in value.
