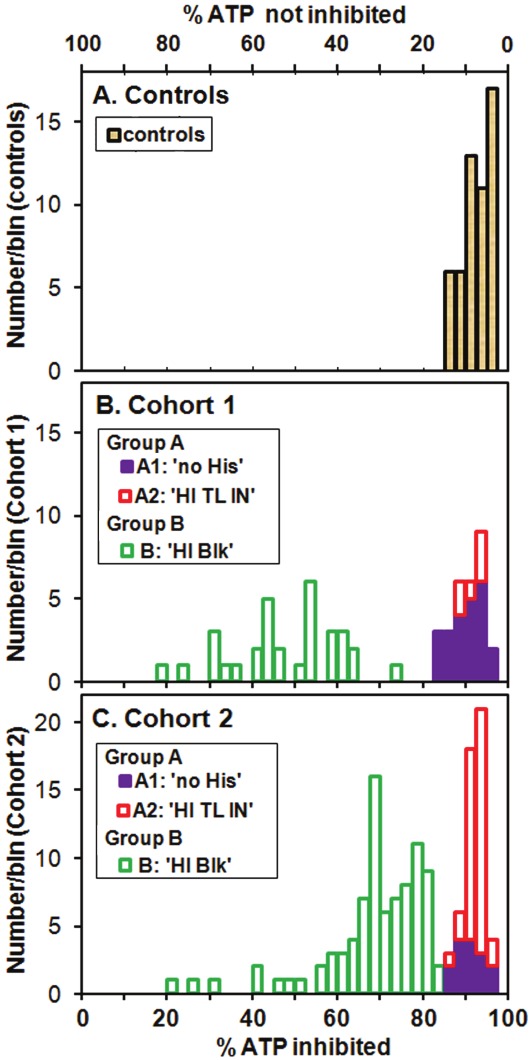
Figure 3.

Histograms of percentage of whole cell ATPMg inhibited 3 min after azide inhibitor is added, for A. the control group, B. patient Cohort 1 and C. patient Cohort 2. For all the controls and for the patients with more than about 84 % of the ATP inhibited, the remaining up to 16 % ATP production with the inhibitor present is consistent with that expected from glycolysis. For values lower than about 84 % inhibited another compensatory pathway for ATP generation must exist.
