Figure 11.

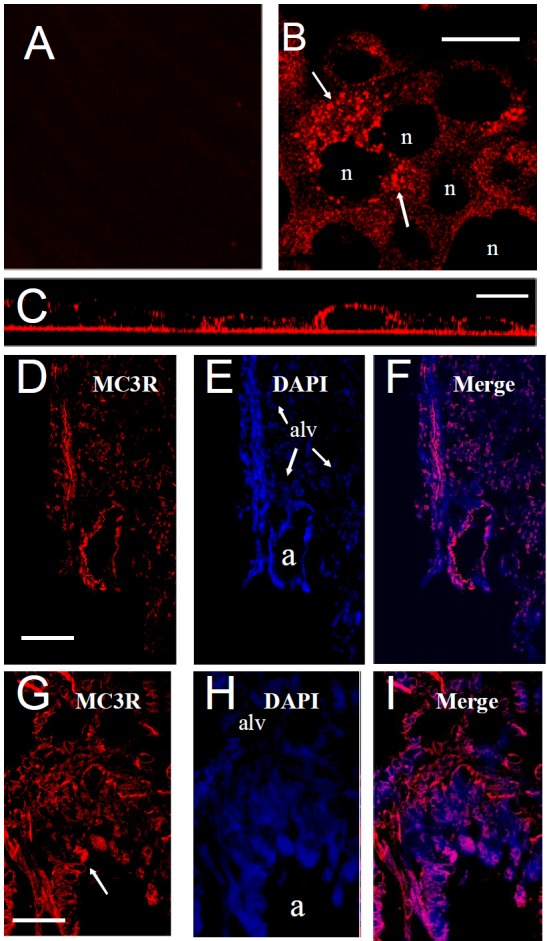
A→I. Distribution of MC3R protein expression in human bronchial epithelial cells and mouse lung. A. Control (2° antibody only), B. MC3R displays punctate expression (arrow) in HBE cells. “n” = nucleus. Bar=15μm. C. Side view Z-stacked image showing predominantly apical MC3R receptor expression. Bar=15μm. D-F. MC3R receptor expression in mouse lung. MC3R, DAPI (blue) staining and merged image respectively, “a” = airway, “alv” = alveoli. Bar = 100μm G-I. Higher resolution image showing apical distribution of MC3R receptor in airway epithelium. “a” = airway lumen. Bar = 30μm.
