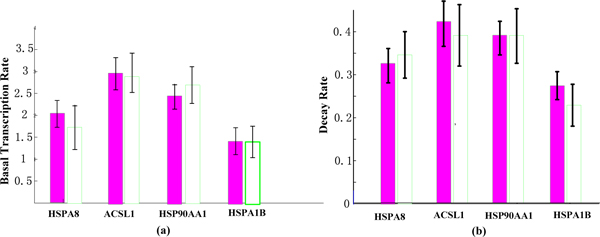
Figure 2.
The bar charts for basal transcription rates and decay rates. (a) Basal transcription rates from our model and that of Barenco et al. Red are estimates obtained with our model, white are the estimates obtained by Barenco et al [21]. (b) Similar for decay rates.

