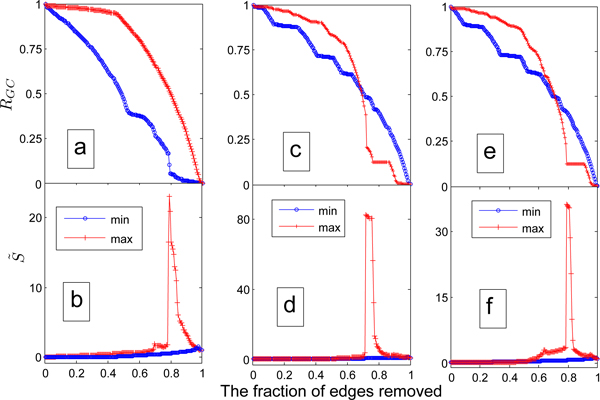
Figure 2.

Edge percolation results on PPI networks. Plots (a) and (b) are for the topological similarity, while (c-d) and (e-f) are for bridgeness. In (a) and (b), the min- (max-) lines represent the processes where the edges are removed from the least (most) similar to the most (least) similar ones. In (c/e) and (d/f), the min- (max-) lines denote the processes where the edges with smaller (larger) bridgeness based on Eq.(3)/Eq.(2) are removed firstly.
