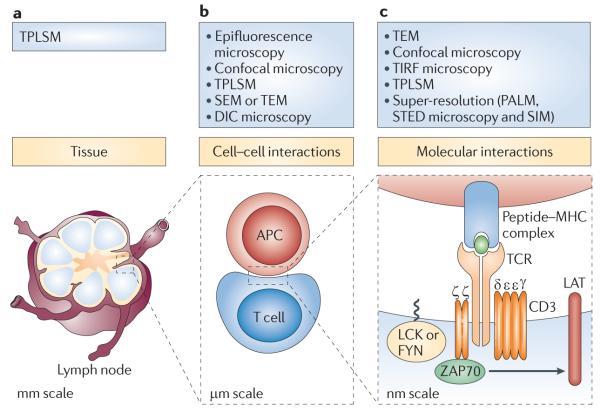
Figure 1. Imaging techniques: hierarchy of scale.
The study of lymphocyte activation requires observation of samples that vary in size over six orders of magnitude. This figure shows the T cell receptor (TCR)-mediated signalling pathway and microscopy techniques used at three levels of sample size. a | In whole organisms or intact tissues, encounters between lymphocytes and antigen-presenting cells (APCs) can be studied in situ using two-photon laser scanning microscopy (TPLSM). The specimen size is tens of millimetres. b | Cell–cell interactions and many subcellular details can be monitored using a large number of conventional microscopy techniques. These samples are typically several micrometres in size, but some details are at the diffraction limit of light scale. c | To observe molecular detail, high- and super-resolution imaging techniques are required. The samples here are individual molecules, only a few nanometres in size. DIC, differential interference contrast; LAT, linker for activation of T cells; PALM, photoactivated localization microscopy; SEM, scanning electron microscopy; SIM, structured illumination microscopy; STED, stimulated emission depletion; TEM, transmission electron microscopy; TIRF, total internal reflection fluorescence; ZAP70, ζ-chain-associated protein kinase of 70kDa.

