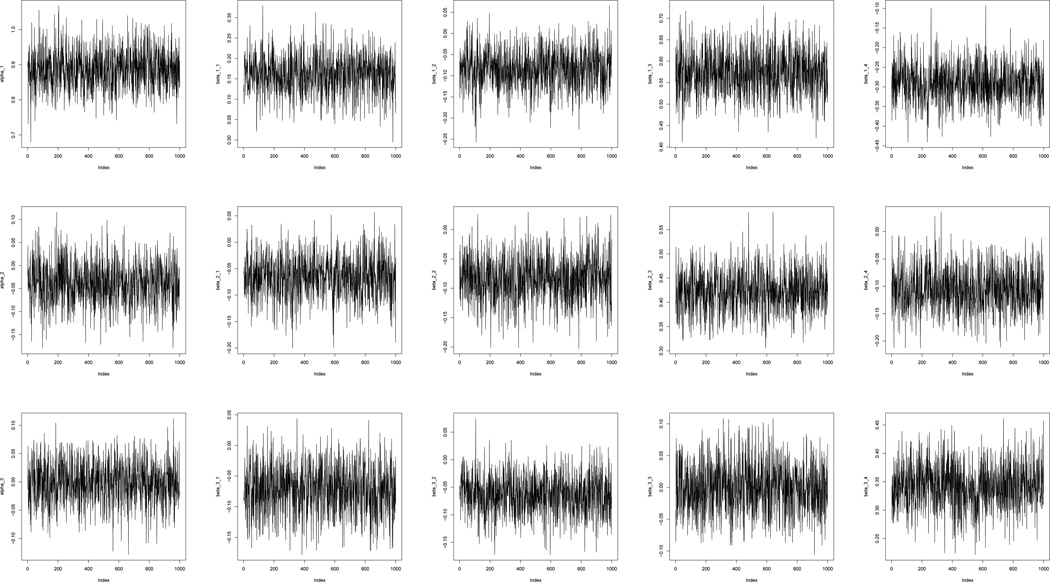
Figure 2.
Trace plot from 1000 MCMC of intercepts and estimated coefficients. First row shows trace plots of parameters for the intercept, age, body mass index, consumption of whole grains and energy intake from whole grains in equation (8). Second row shows trace plots of parameters for the intercept, age, body mass index, consumption of whole grains and energy intake from whole grains in equation (9). Third row shows trace plots of parameters for the intercept, age, body mass index, consumption of whole grains and energy intake from whole grains in equation (10).

