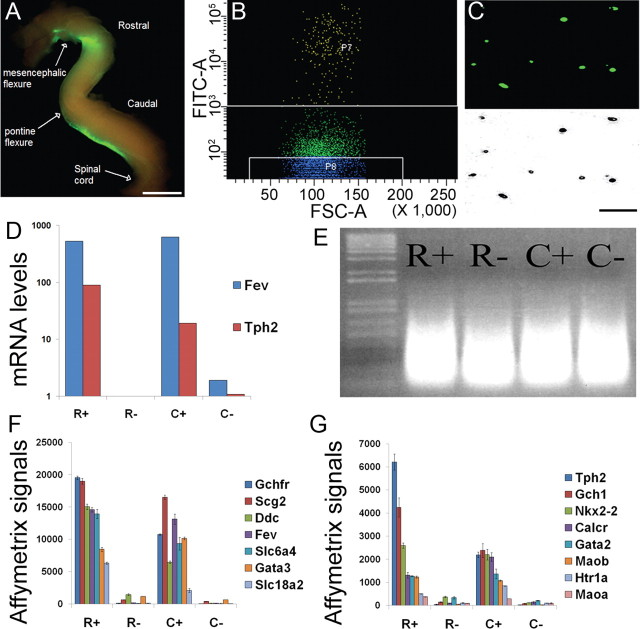
Figure 2.
Purification and expression profiling of rostral and caudal 5HT neurons. A, E12.5 ePet-EYFP neural tubes were dissected and incisions made at the mesencephalic flexure, pontine flexure, and spinal cord to separate the rostral and caudal domains. B, Single-cell suspensions of rostral and caudal neural tubes were subjected to FACS. EYFP + cells were collected in gate P7 (top) and nonfluorescent cells were collected in gate P8 (bottom). The fluorescent and nonfluorescent fractions were separated by one log unit to ensure pure populations for gene expression profiling. C, Sorting efficiency was verified by examining purified cells under fluorescence (top) and phase-contrast (bottom) microscopy. D, RNA was isolated from rostral YFP+ (R+), rostral YFP− (R−), caudal YFP+ (C+), and caudal YFP− (C−) sorted cells and then assayed by Taqman RT-PCR for two known 5HT neuron-specific genes, Fev and Tph2. E, Total RNA from 200,000 sorted cells each for rostral 5HT YFP+ (R+), rostral non-5HT (R−), caudal 5HT YFP+ (C+), and caudal non-5HT (C−) was used for one round of amplification to generate cRNA probes. F, G, Enriched expression of well established highly expressed (F) and more moderately expressed (G) markers of 5HT neurons were detected in R+ and C+ neurons by microarray hybridization. The y-axis equals the gene expression level determined by MAS 5.0. Error bars represent SEM. Scale bars: A, C, 100 μm.

