
Figure 3.
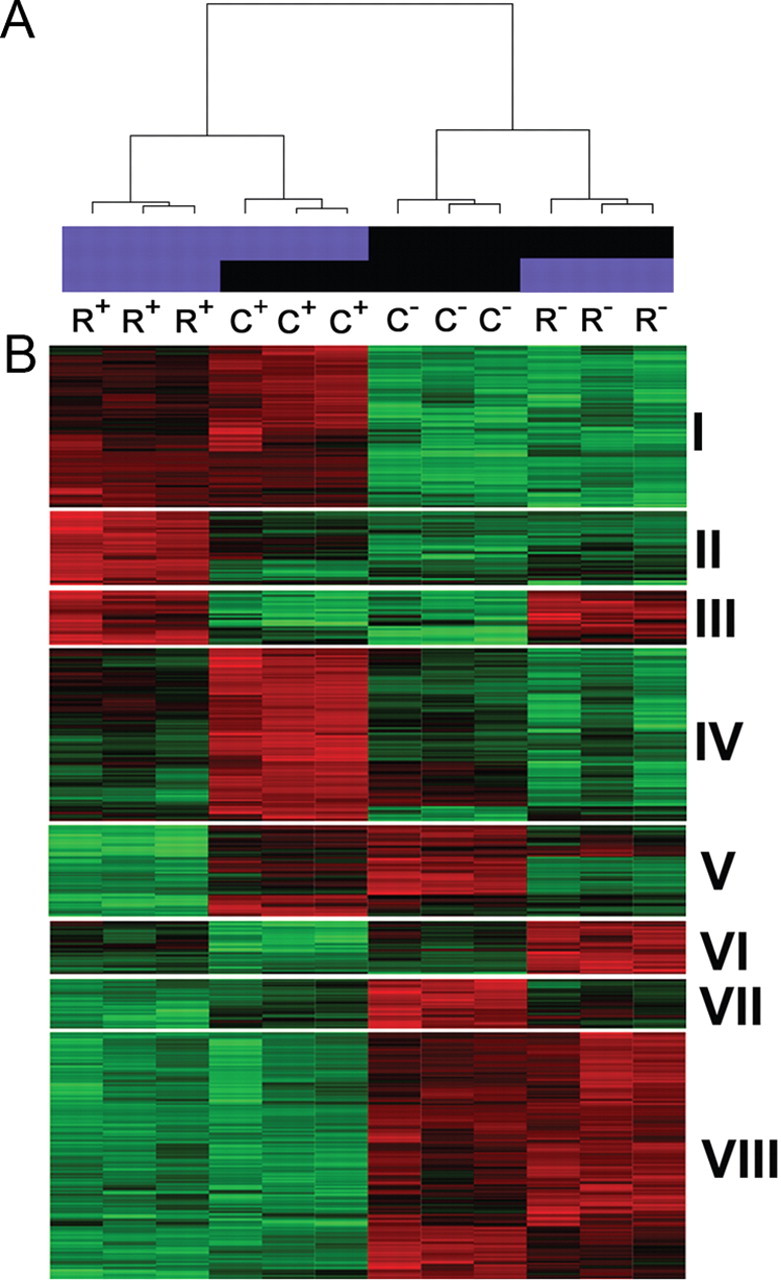
Unsupervised hierarchical clustering of serotonergic gene expression. A, Dendrogram showing unsupervised hierarchical clustering of R+, C+, R−, and C− gene expression profiles from the 12 arrays. Biological replicates show a high degree of reproducibility. B, Heat map displays eight distinct clusters of enriched gene expression in R+, C+, R−, and C− cell populations at E12.5. Each row represents the relative levels of expression for a single gene. The red or green color indicates high or low expression, respectively. Each column shows the expression profile for a single biological sample. Cluster I, Enriched gene expression in rostral 5HT and caudal 5HT neurons (R+C+); cluster II, enriched gene expression in rostral 5HT neurons (R+); cluster III, enriched gene expression in rostral 5HT and rostral non-5HT neurons (R+R−); cluster IV, enriched gene expression in caudal 5HT neurons (C+); cluster V, enriched gene expression in caudal 5HT and caudal non-5HT neurons (C+C−); cluster VI, enriched gene expression in rostral non-5HT neurons (R−); cluster VII, enriched gene expression in caudal non-5HT neurons (C−); and cluster VIII, enriched gene expression in rostral and caudal non-5HT neurons (R−C−).