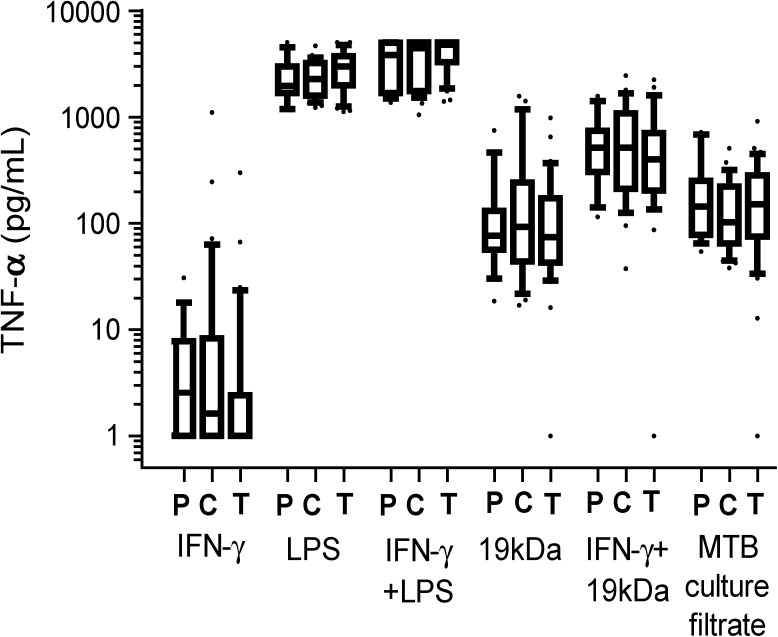
Figure 2.
TNF-α responses of PTST− (n = 19), TSTC (n = 42) and TST+ (n = 42) contacts at baseline in response to innate receptor ligands. Whole blood was stimulated overnight with either IFN-γ, LPS, IFN-g pretreatment followed by LPS (IFN-γ + LPS), 19 kDa LpqH (19 kDa), IFN-γ pretreatment followed by 19 kDa LpqH (IFN-γ + 19 kDa) or MTB CF. Supernatants were harvested after 18 h and TNF-α measured by ELISA. Results presented are the mean ± SD of single measurements for each group of contacts. P are PTST− (N = 19), C are TSTC (N = 42) and T are TST+ (N = 42). Box and whisker plots with the whiskers defining the 90th and 10th percentiles. *There were no statistically significant differences among the 3 groups (P > 0.05).

