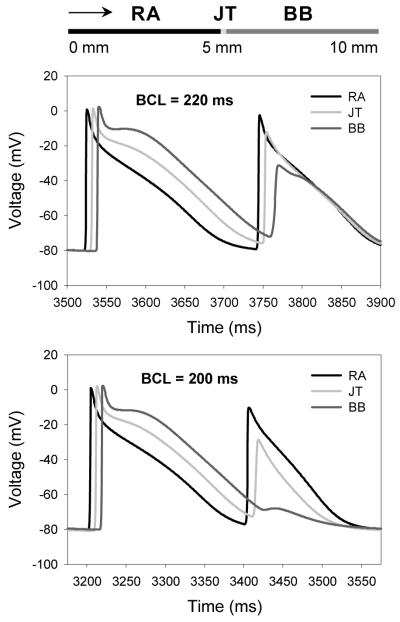
Fig. 4.
Slowing and block of AP conduction between the RA and BB regions of 1D tissue strand. Top: Schematic illustration of the 10 mm strand comprising of the RA cells (0-5 mm) and BB cells (5-10 mm). Arrow shows the direction of AP propagation. APs are recorded from the middle of the RA region, the middle of the BB region and the RA-BB junction (JT). Middle: Slowing of the AP conduction can be seen as the increased time delay between APs from the JT and the BB regions. Bottom: Block of the AP conduction through the BB region.

