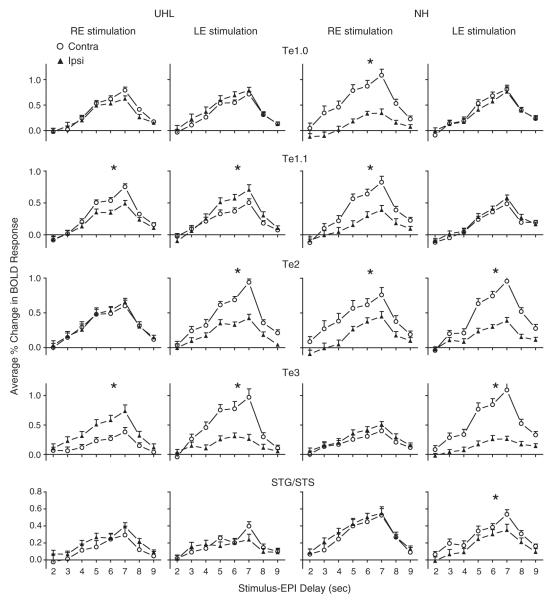
Fig. 3.
Lateralization comparisons (Contra, open circle; Ipsi, filled triangle) of BOLD responses evoked by each stimulated ear (RE or LE) and in each hearing group (UHL or NH) for five different paired auditory cortex ROI. With RE stimulation, ipsilateral responses were in the right hemisphere and contralateral responses were in the left hemisphere. With LE stimulation, ipsilateral and contralateral responses were, respectively, in the left and right hemispheres. Plotted at each stimulus–EPI delay is the mean and standard error of the mean for the per cent change in BOLD responses over baseline across participants within a group and ROI. Asterisks denote statistically significant differences between comparisons (see Table 3 for p-values).

